Happy Easter Sunday Everyone!!

Even though it is Easter, we still need to keep up with our marketing blogs. This week mainly focused on getting our butts in gear with our smart projects. It was quite busy, and interesting. Well, okay, we admit it; we barely did any work for our smart projects in the past two weeks. And with the joint meeting and Customer Discovery both on Thursday, we were very behind. Let's just say that those weeks where I was relaxing were all building up to a week of zero sleep. Note to self: DO NOT DO THAT AGAIN. Anyways, this week's blog is going to strictly be dedicated to the customer discovery process that my team managed to finish in the matter of three days. Pretty impressive!? Yeah, more like pretty stupid for not doing this earlier.

On Monday, we had our meeting with Professor Spotts that fulfilled our requirement for attending class on Tuesday. We discussed the progress of our smart project, which was barely anything at all, and personally, I felt panicked after that meeting. I felt completely overwhelmed by the excessive amount of work that needed to be done, and all I could see in the back of my mind was a clock ticking, with the time running out very quickly. I think we needed that meeting where he basically said, "Well, what have you been doing the past two weeks?" That really motivated me. As someone who desperately wants to strive for a 4.0 to impress the big 4 accounting firms, this is a class I NEED to get an A in, and it was extremely foolish for me to sit back and let time go by when there was tons of work to be done. I think my team needed a little bit of a kick in the ass, and we certainly got it in that meeting. We went over how to use IBIS World, and immediately after leaving the meeting, I sat my butt in the library until 2am finishing our industry report.

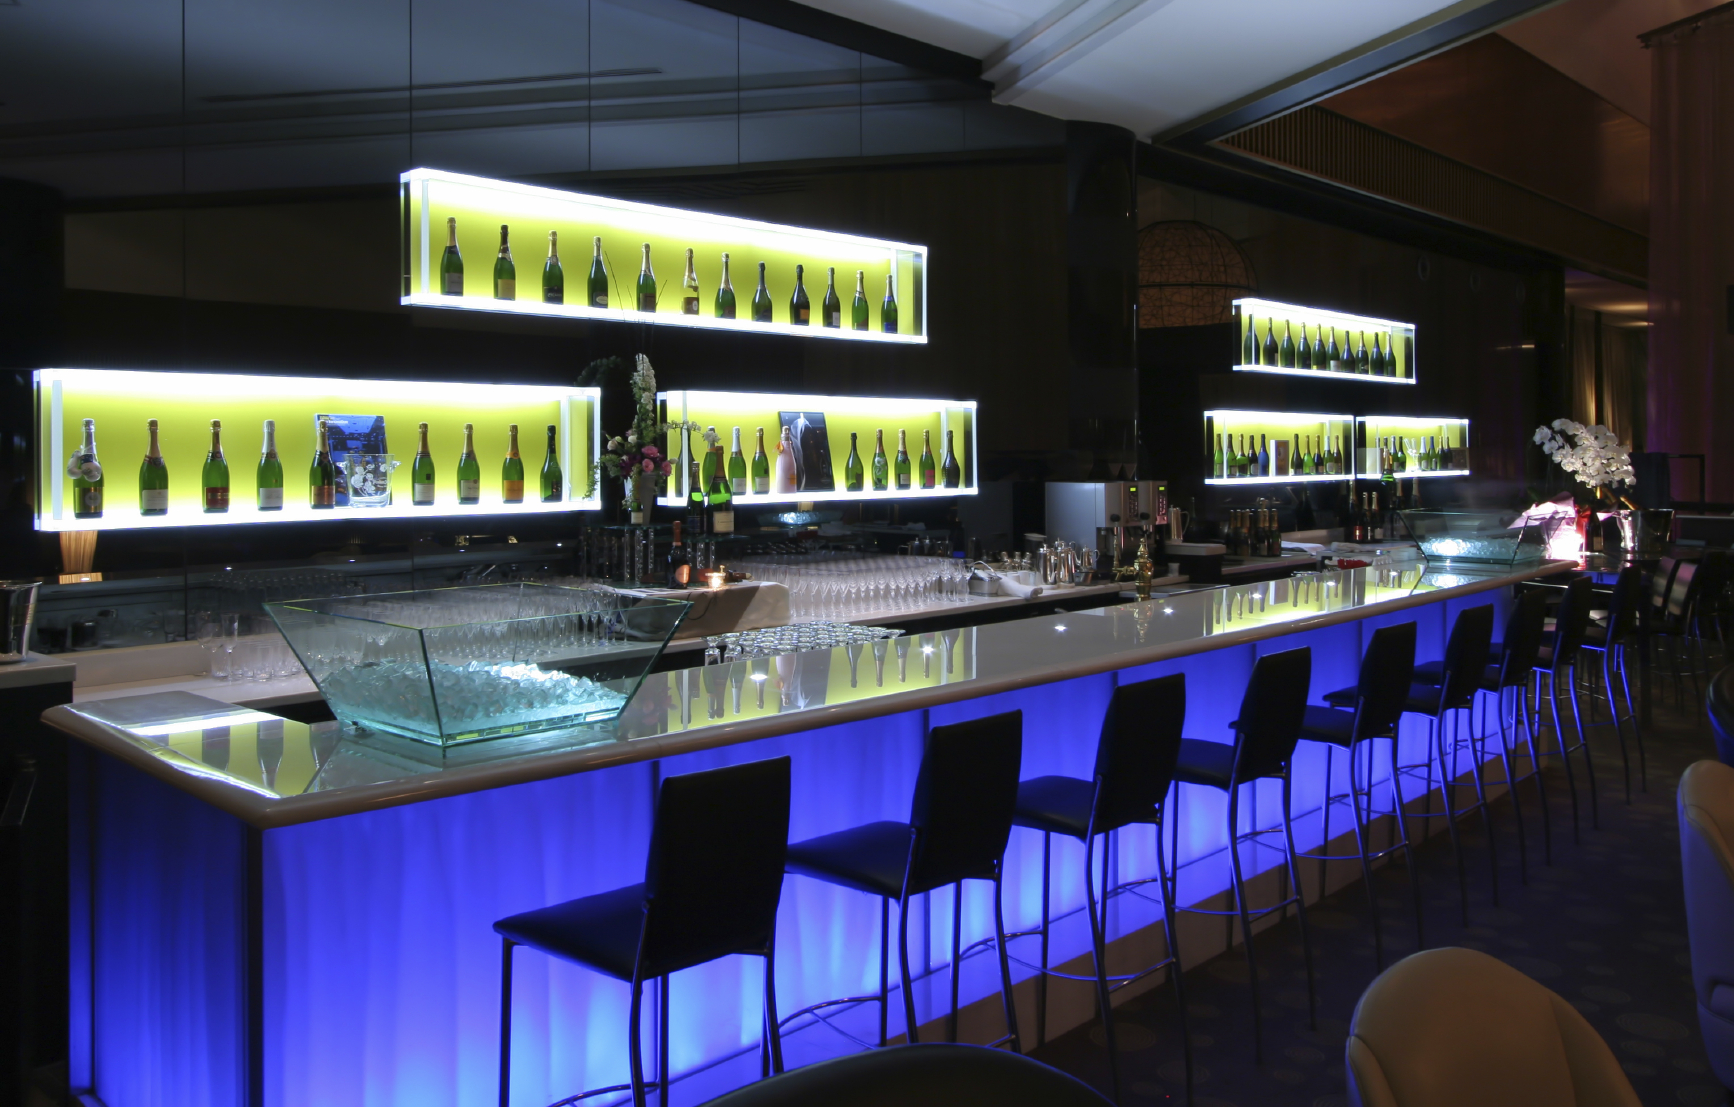
IBISWorld has been my absolute best friend this week, as it is currently the #1 visited website on my laptop! IBISWorld has provided my team with a wealth of knowledge about the bar and nightclub industry. An industry is a collection of companies with very similar business activities that sell similar products or services to the same customers. Our industry includes bars, taverns, pubs, lounges, nightclubs, and other drinking places that primarily prepare and serve alcoholic beverages for immediate consumption. On IBISWorld, we were required to research our industry, and then take notes on what information about the industry is, and how it may be relevant to our OK 2 DRIVE project.
IBISWorld provides the data, but in order to let that information help us, we need to apply it to our smart project and analyze it. Yeah, it is great that we found out that 7.3% of the people in our target geographical areas enjoy taking risks, but what does that have to do with our breathalyzer activated lockers? That is all about analyzing and interpreting the data, and then providing insight. I actually found this quite interesting.

IBIS WORLD REPORT
DATA: The Bars and Nightclubs industry is in a mature phase of its life cycle. The industry is highly competitive and is facing increased competition from other industries, such as casinos, full-service restaurants, as well as establishments that sell packaged alcohol, such as supermarkets and convenience stores. The number of industry establishments is expected to decrease at an annualized rate of 0.1% over the 10 years to 2022.
ANALYSIS: This is helpful to our smart project because it shows that the number of bars and nightclubs are decreasing. What does this mean for our OK TO DRIVE team? Well, we already presented that an idea for this product could be used as a rental for house parties, and it seems like that is something that we are moving toward in business. People seem to prefer a laid back partying setting, which validates the benefit of rentals. Additionally, with bars decreasing, it shows that the options for alternative locations for social gatherings is diminished. If a patron is upset about breathalyzer activated lockers being enforced as a bar policy, they will be less likely to search elsewhere for another location. Although, it is a negative that the establishments will be decreasing because bars are the market we intend to reach with this product.
DATA: The Consumer Confidence Index is expected to decrease in 2017, presenting a potential threat for the industry. As consumer sentiment increases, households are more likely to increase discretionary spending in bars and nightclubs. Changes in consumer sentiment influence decisions that individuals make concerning expenditure on entertainment and traveling, particularly during an economic recession. Although, the report also states that the consumer spending rate is supposed to increase for 2017, which could help the industry.

ANALYSIS: With people not going to the bars as often, bars may not feel the need to activate this system in their businesses. With consumer spending rate increasing, it contradicts the consumer confidence index, which really leaves me at a loss. Consumer confidence and consumer spending rates fluctuate frequently, but maybe that means that people will spend regardless of their confidence about what is in their wallet. It is honestly difficult to analyze those two pieces of data together, for they are opposite of one another, and one could work in our favor, while the other one may hurt our business.
DATA: “Lingering concerns over a possible rise in binge drinking rates, particularly among young adults, could place the industry under increased government scrutiny. Data from the US Department of Health indicates that the highest prevalence of binge and heavy drinking occurs in young adults between the ages of 18 to 25, peaking at 21 years old. More than one-third of young adults are classified as binge drinkers. As a result, further restrictions on alcohol sales and promotions could be placed on the industry to combat binge drinking. These restrictions may include controls over the sale of kegs, happy hour promotions, beer sales of pitchers and large containers and alcohol advertising, limiting potential revenue growth. However, it is unlikely that alcohol laws will change significantly during this period, especially with lobby groups influencing both sides.”

ANALYSIS: Although alcohol laws will probably not change in the near future, it is interesting to see that the industry is actually concerned with their relationship with the government. If binge drinking is seen as one of those issues, then there is no doubt that drinking and driving will be an issue they would like to address as well. In order to continue having a positive relationship with government officials and law enforcement, this product might give them a great reputation. This shows that the bars and nightclubs do actually care about the wellbeing of their customers, so this might be a great product to secure the status of their venue, as well as the safety of their customers. Police officers may have less issues with bar owners if they see that this product is being enforced as a policy at the location. Additionally, traditional bars that have not updated their concept in years face the biggest threat, however, as small, intimate settings that provide a casual ambience have become increasingly popular with consumers. Consumers may find this intriguing to enforce this policy and system in bars, so it might grab the attention of the bars and bring in more customers, which hopefully means more business. A consumption trend has also had an impact on the bar and nightclubs’ image in the business world. Over the past five years, per capita alcohol consumption has remained stagnant, reflecting increased awareness of the harmful effects of overdrinking and “zero tolerance” laws in some states regarding underage drinking. Stricter laws for drunk driving and public intoxication have also influenced consumption patterns. Industry revenue has been hurt by an alcohol consumption trend toward consuming wine, spirits and ready-to-drink products at home or in other licensed venues instead of drinking at the bar. People are aware of these issues, so with a product like our breathalyzer activated lockers, people will not have to worry about if they are okay to drive home or not. The breathalyzer will tell you and return your keys, or will assist you in an alternative way to return home. This issue has increasingly been publicized, so OK TO DRIVE lockers will be able to help address the problem while also allowing consumers to relax and have fun.
DATA: The Bars and Nightclubs industry is subject to a low level of technological change. “The main incentive to increase the use of technology, which is to reduce a reliance on physical labor, is not as prevalent for this industry, particularly at the small-scale end of the industry.”
ANALYSIS: A technological change like having breathalyzer activated lockers introduced will lead to efficiency and safety. Although small bars and restaurants will be weary of potentially giving up their degree of personal service, they are actually just showing their carefulness and attention to the wellbeing of their consumers.When looking at the report, they are not thinking of a technological product that would increase the safety of their consumers, they are immediately thinking that technology will take away jobs of their current employees. In this case, this would actually create job opportunities, for bouncers will be hired to oversee the technological process. This is not just trying to have a machine distribute alcoholic beverages, for it is something unique and different, which would most likely be seen as a beneficial integration rather than a device that will kill the opportunities for jobs. In general, small business owners do not have a strong incentive to invest heavily in new technology due to the limited economies of scale available. This will be helpful if they have had legal issues in the past due to drinking and driving, and can be seen as an advantageous investment, rather than an expense.

This is where interpreting data can be helpful. If we were just to take the data piece that technological change in bars is low, then we might just give up. But that is not necessarily related to our project or product. We are introducing a technological device that is not meant to reduce labor, for it is mainly to increase safety regulations, which is something that is seen as a difficult portion of the bar & nightclub industry, while also increasing their liabilities toward the patrons without a product like ours. Technology can be used by bar and nightclub operators to improve internal business processes, such as ordering inputs and all other back-of-house functions, but in this case, it would be checking in on their customers and making sure they are safe. “Confiscation of keys” will become more efficient due to technology, and can help keep track when bartenders are dealing with a huge crowd and want to keep their customers safe on the roads. These improvements can deliver a competitive advantage against competitors, which is especially important given the fierce level of industry competition.
Revenue from cover charges and admissions to bars and nightclubs represents about 2.6% of total industry revenue. This means that it is not a major source of revenue for the bars. But, it also means that it did not completely determine whether the customer continued to come to the bar or not. It did not make much of an impact, so this product won’t be much of a hassle, but the impact could be life-changing.
Rising health consciousness about the negative impacts of excessive alcohol consumption can have a negative impact on industry demand. This product will help alleviate some of the stressors associated with health consciousness. As government campaigns and the media raise awareness of the negative consequences caused by heavy drinking, such as disease, injury, crime and lost productivity, the number of people attending bars and clubs may decrease. With something like breathalyzer activated lockers to hold individuals accountable for their alcohol consumption, it will help minimize some of the concerns of those who stopped coming to bars due to fear.
The biggest spenders on alcohol per capita, according to the US Census Bureau, are those aged 34 years and younger. According to a survey by Centers for Disease Control, about 56.0% of those aged 18 to 45 are current regular drinkers, compared with 50.0% of the total population. Given these findings, customer demographics will vary according to whether the establishment is located in a college town or elsewhere, and depending on the concept, which could be a neighborhood bar, an on-premises beer-brewing tavern, a sports bar, a wine bar or a nightclub. This is a population that has been educated a lot more recently, which will help individuals want to participate in this system. Unfortunately, a portion of this market segment has probably been impacted negatively by the action of drinking and driving, which will help people understand the importance and meaning behind this product and process. As a service-based retail industry, bar and nightclub operators are dispersed largely in line with population and income distribution. The industry is concentrated in the West, Great Lakes and Mid-Atlantic regions, mainly due to population distribution and size. Most of these regions have a large number of relatively small establishments in terms of employment and revenue. However, the industry tends to also be under-represented in the Southeast region. Licensing restrictions in some states also have an impact on this industry's operations and location. This helps us understand where we want to release our product, and where we should advertise for these breathalyzer activated lockers. Research by the US Department of Agriculture indicates that the states with the highest per capita consumption of distilled spirits are New York (7.8% of industry establishments are located here), Florida, Texas and California (7.2%). California is located in the West region, which comprises 13.4% of industry establishments. These are states that have the highest population of bars and nightclubs. This helps us get an idea of where it would be beneficial to promote the product. Something that is interesting is that many of these states have major cities, for that could be a part of their high ranking among other states. The Adams Handbook indicates that the states with the highest consumption of domestic and imported beer are: Texas, located in the Southwest region (8.6%); Florida, located in the Southeast region (13.6%); Illinois (6.5%) and Ohio in the Great Lakes region (25.6% of industry establishments); and New York and Pennsylvania (6.9%) in the Mid-Atlantic region (19.0%). The information also points to beer consumption as a key indicator of this industry's geographic spread, along with population size. Other states, are high because of the lack of other events and opportunities, so bars and nightclubs are seen as a necessary location for social gatherings considering their ability to have other recreational activities are quite limited. IBISWorld does not expect the level of geographic concentration to change in the near future, so that is helpful in determining a long term business plan for our OK TO DRIVE breathalyzer activated lockers. Location is a big deal with businesses, and IBIS world has allowed us to narrow down our key geographic areas by providing this information in the industry report.
Looking at the cost structure benchmarks, it is difficult to see where our OK TO DRIVE product will fit in. Other costs include those incurred in the normal course of business, such as insurance, accounting and legal costs, licensing fees, and stationery and office costs. These costs account for an estimated 12.2% of the average bar or nightclub operator's revenue. By investing in OK TO DRIVE breathalyzer activated lockers, those legal costs may potentially decrease by decreasing their liabilities. The average sector versus industry costs does not necessarily provide insight for a product like ours. This means that although the product may decrease the categorized “other” costs, it also may balance out. That depends on whether this product would be classified in the category of “other” costs. Otherwise, businesses would need to dip into their profit in order to invest in that product. That will be quite tricky to have bars and nightclubs voluntarily do that. Considering that the average profits for this industry are about 5.6%, that would mean a portion of that would be added into the costs section, for the OK TO DRIVE products. Due to the small and localized scale of bars and nightclubs, there are few major operators, and financial data and other details on their operations are sparse. In 2016, IBISWorld estimates the average revenue per establishment will increase to $356,780, up from $321,350 in 2012. The average number of employees per establishment is estimated to be about six, with an average annual employee wage of $15,145. A portion of that would go to the investment of breathalyzer activated lockers. That will take a lot of convincing for a bar or nightclub to take away from their earnings when they are already making money without our product. Emphasis on reputation and legal fees would have to be key in order to really get the bar and nightclub owners on board with this system.
This industry varies widely in terms of style and concept. With a product like ours, it will add some diversity to the industry, and will definitely get people talking. Some operators can be classified as neighborhood bars, which usually serve drinks and meals and provide entertainment to a number of regular customers. The neighborhood bar is likely the most common concept adopted by the industry's establishments. These neighborhood bars are most likely to understand and appreciate the core values and importance of implementing this system. Sports bars display sporting memorabilia and provide live telecasts of important international, national and local sports events. This will attract a larger crowd, harder to keep up with, and the product will help keep the entire population safe, with no one being disregarded. All of these types of establishments are niche operators, which tend to appeal to a core demographic and, therefore, must provide the facilities and ambience preferred by key customers. Key customers will evidently want to have their safety ranked as a high priority of the bars and nightclubs.
Now, obviously that is a lot of information from our Customer Discovery assignment, but I wanted the rest of my peers to see that, and not just Professor Spotts for a grade. My classmates frequently have questions about some of the topics I covered in the IBIS World Report, so that is why I thought it would be convenient to take directly from my assignment. This way my classmates can stay updated on some of the info and data we collected :)
Market Research
Unfortunately, marketresearch.com did not having much information on the bar and nightclub industry and those who are customers in that market. So, I needed to research elsewhere. This got me thinking to the data that Professor Spotts collected on Gato Cafe, and Fresh Patch, where he was able to get data about dog owners; for instance, how many dogs they own, where they live, if they give them treats, etc. I started to think that the type of information there could be helpful for our product as well. Obviously, looking at alcohol consumption, location, feelings & attitudes, etc. Not about dogs for this project...

I started to brainstorm. I could use Simmons instead of marketresearch.com! Now, I just needed to decide what type of information I wanted to be looking for. Off the top of my head, I came up with the following:
- Drinking
- Driving
- Drinking and Driving
- Bar Locations
- Age Groups
- Geography
- Income
- Family Life
- 21 and older
- Fears of drinking and driving
- Car accidents

When looking at markets, you start broad and narrow down. The total addressable market is seen as the broadest version of a market. This is the total revenue opportunity for a particular product or service. It is seen as the total universe without any competitors or constraints, and is defined in global terms. For our OK 2 DRIVE project, our TAM would be anyone who cares about the overall well being of society. Obviously, if this were the case, then everyone would go out and buy our product, but that is highly doubtful. So, in order to attract consumers, we narrow it down. Next is SAM: sales or served addressable market. This is a realistic sizing of the market, and it accounts for limitations of one's sales channels. For example, they take geographic limitations into account. Our SAM would be bars, event venues, rentals for house parties, restaurants, Sweet 16s, weddings, etc.
After that, you get into the target market which is the segment that has been prioritized as the most feasible or desirable in our market. This is the focus for most entrepreneurs & startups. The top down approach uses high estimates as their methodology for finding the target market. You start with a broad statistic from secondary sources that will be tied to the channel where you sell the product and the number of businesses in your industry in a geographic area. Then, you break that market down to your market size which will help with the research portion of this project. To find the data points we needed, we mainly used IBISWorld and Simmons. In order to verify that data, it is important to find similar data in more than one report, which we did in our secondary sources.

According to IBIS World, there are a majority of states that do not have many bars, nightclubs nor restaurants who rely on alcoholic beverages as their main source of income. For this reason, we used the 5 states that had the highest percentage of drinking and bar establishments. Those states were Florida, New York, Texas, California and Ohio. I found this quite interesting. These are some of the largest states, and also contain some of the largest cities in the world. This helps us understand that cities will play a major role in the market of this product.
First we wanted to clarify- do these states participate in drinking alcoholic beverages? We used Simmons data to find out this information. According to California’s population, 47.9% have drank alcohol in the past thirty days. According to Texas’ population, 45.2% have drank alcohol in the past thirty days. New York: 49.1% Ohio: 54.3%. Florida: 52.8%.

Of those numbers, we then distinguished what these people are drinking. We separated the alcohol into groups of beer, wine and liquor. Then, each form of drink was separated into the category of where the drinking took place. For New York, the majority of alcoholic consumption occurred in their own home. This will be helpful when looking at house parties and if the rentals will be a useful product. For beer consumers, the next place they would normally drink is at a restaurant. The same goes for wine and liquor. Same went for Texas, California, and Florida. Ohio was different. If It wasn’t your own home you were drinking at, then it was someone’s house. This validated that rentals will be a great option for house parties.
Is gender important here? We did put gender into our Simmons studies. There was not much difference in the data between men and women, as far as drinking alcohol went. They each did, however, have their own preferences on what drinks they liked and where they liked to consume their alcohol, but the percentages were too close to really tell a true difference.
Now, What age group does your ideal customer fall into? With our product, we needed to test individuals above the age of 21. That is the legal drinking age. According to the market segmentation reported by IBIS World, our main market is consumers aged 45-54. They make up 22.4% of the major market segmentation. Next comes consumers aged 25-34 at 19.3%. Then 18.5% are consumers aged 35-44. Because of these numbers, and the fact that they are only going on to the age of 65, we only used that sense of data in our Simmons analysis.
CONSUMPTION: YES
Ohio: Aged 35-39
New York: Aged 50-54
Florida: Aged 50-59
Texas: Aged 40-44
California: Aged 30-34
BARS: BEER
Ohio: Aged 35-39
New York: Aged 30-34
Florida: Aged 55-59
Texas: Aged 40-44
California: Aged 30-39
RESTAURANTS: BEER
Ohio: Aged 35-39
New York: Aged 30-34
Florida: Aged 55-59
Texas: Aged 30-44
California: Aged 35-39
This gives us an idea of who is drinking, what age they are, and where they are drinking in these states. Now, What annual salary do they earn? What about education levels?
For this product, salary and education do not necessarily play a role in using or buying our product. But, we have to conduct this more thoroughly.
Next we took into account lifestyle statements for these states. We did research on if people go to bars and nightclubs, while also taking into consideration their gender, and age. Then we tested for people who prefer a quiet night instead, rather than going out. This will help us by determining if that alternative of staying home is greater than the willingness to go out at a club or bar. This can help us determine whether our product is a need or want, and what the demand for it is. Next we looked at how many people enjoy life and do not worry about the future. If they are not worried about their future, will they care about drinking and driving? Will they be more likely to do it? Then we looked at who said that they enjoy taking risks. If this is a big number, then that can help us argue to bars that our product will help save lives. Risk takers will be more likely to drink and drive. Next we looked at people that say they do not like responsibility, and would rather be told what to do. People like this would enjoy going to bars with breathalyzer activated lockers because they do not have to worry about whether they are okay to drive or not, for they would be told immediately if they can or not. Putting the responsibility on this apparatus is a benefit of this machinery. Next we asked if people enjoy entertaining in their home. If so, then house parties could use this product as a rental for their events to insure their guests get home safe. “I often do things on the spur of the moment” These are people who wont be concerned with drinking and driving, and that is why a bar should enforce a policy using our product to ensure the safety of patrons. Next, “I worry about violence and crime.” This can show that people do care about the well being in these areas, and we could infer that those people will not be content will intoxicated operators on the road in their neighborhood, validating the importance of our product. Next, we looked at whether people often drink alcohol at restaurants to make sure that this would be a relevant product for restaurants. “I like to try new drinks” also validates that there is a substantial size for this market.

We then determined the percentage of individuals who strongly agree with the attitude of drinking at restaurants and getting drunk at restaurants. This will help prove to restaurant owners that if the number of people is large enough, then they need to do something about that to prevent liability from being on their business. Then we also questioned the statement of “The point of drinking is to get drunk.” If this is the case, then drinkers should not be driving home. For example, for the states of Massachusetts and Connecticut, we tested the attitudes of full time college students who have a strong agreement about drinking at restaurants AND getting drunk. 20,000 students, just in the state of Massachusetts and Connecticut came up as candidates. People like this need to be using a product like ours, which is essential for the pitch to bars and restaurant owners about the importance of this product. When you take college students out of the mix, 50,000 adults, aged 21-24, feel the same way. This is only one age group in only two states. What does this say for the rest of the U.S? It says that OK TO DRIVE should be enforced!
Neighborhood feels can have an impact. Family owned restaurants and bars will be more likely to invest in this product, for they truly show that their customers mean something to them and would be hurt if they lost one of their patrons to a drinking and driving tragedy. I think small town people will understand the significance of this product, and especially those who have been impacted, indirectly or directly, by drunk driving fatalities. This product can help keep our roads safe.
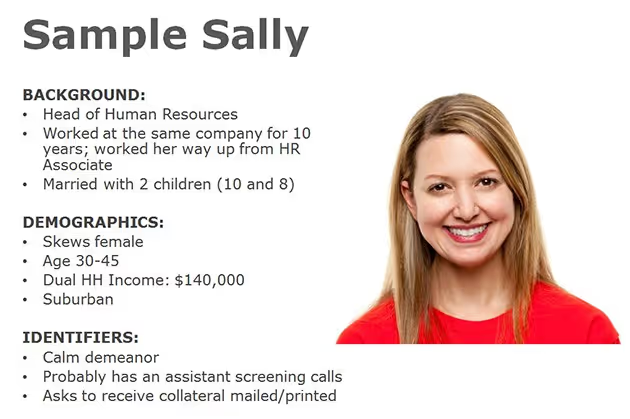
I met with our marketing consultant, Sam DiGiovanni, and she helped me with a portion of the Customer Discovery project. As I was collecting the data on Simmons, she said, "Has Professor Spotts talked to you about Buyer personas yet?" She gave me information on them, and that is what our market research report is, basically a buyer persona. Ironically, on Thursday, Professor Spotts discussed how we need to create a buyer persona for our product. Sam taught me before Professor Spotts even needed to! That is why our marketing consultant is great (and deserves a good grade). Figured I would put that in there so Sam knows I'm advocating for her! A buyer persona is a semi-fictional representation of your ideal customer based on market research and real data about your existing customers. When creating your buyer persona, consider including customer demographics, behavior patterns, motivations, and goals. The more detailed you are, the better. Demographics takes into consideration population segments. Here, we will think about where they are from, importance of gender, age groups, salaries, and education levels. Then we go to psychographics, which takes the way our ideal customer thinks into consideration. Here we will think about what brands they identify with, what aspirations they have, what their hobbies are, and what kinds of ideals they hold onto. Behavioral is the section which helps understand how your target customer behaves. This looks at their past purchases, favorite shops, visiting websites, and applications used on their electronic devices. Environmental is the section to help us understand the environment that our ideal customer lives in. We would look at the languages they speak, the countries they live in, the payment methods available to them, and the modes of transport they normally use. Since I already used the buyer persona as an outline for our market research report, we have a bit of an advantage and now we just need to conduct more research in order to actually create the buyer persona. We simply just have the data to create one now. In class we were given some examples, and now it time to have one for Tuesday.
In class, we also discussed the importance of our value proposition. Our value proposition contains a headline which is a short statement about the end benefit we offer. It is important to grab the attention of our customers with this headline. Then, we need a 2-3 sentence explanation on what we offer, for whom do we offer it, and why it is useful. In addition, we should have some bullet points about the key benefits and then also provide a visual for the product. This helps explain a promise of value to be delivered and should be the primary reason a prospect should buy from us. It should be a clear statement that explains how your product solves customer pain-points or improves their situation. It explains why we are relevant. It shows our specific benefits and what our quantified value is. Lastly, it tells the ideal customer why they should buy from us and not from our competitions and gives the reason as to why we are uniquely different. Dr. Gettens and Professor Spotts explained to us that the entire team should have our value proposition memorized. Our expo is coming up, and we need to be ready to pitch to "judges" (not sure if they are judges) about our product and why we have value. It is important for everyone to know this. Why? If one person has the value proposition understood, then what happens if two people come up to our board and want to talk to another person in the group. They cannot just sit there and say "uh, wait for my partner to finish explaining the product to that person, and then they'll explain to you next." We all need to be capable of presenting OK 2 DRIVE to people who have never seen anything like this. On Thursday, we were able to brainstorm about what our headline will be and where we will go from here. We saw some examples and got some ideas of what we want to do. Ultimately, there is a technology side and a marketing side of this value proposition. But we also need to make it attractive to look at, for that is of the utmost importance.

Overall, the moral of the story is, do not slack off. Get your crap together and start your projects sooner. Some might be reluctant to admit that they are behind, but I am not shy. I want to address this because it was a huge flaw of mine in this course, and now I need to work and improve upon that. Like I said to Professor Spotts, Have faith. We will get the job done, but that does not mean that we should not have started sooner. This OK 2 DRIVE project will turn out great, simply because I am determined to make it great. But in the future, I will not be letting things slide by. I will definitely be doing things on time, if not earlier, in order to live a less stressful life, and hopefully, that life includes some sleep.

This is one of the most fantastic reflections I have ever read!!! Great read!
ReplyDelete